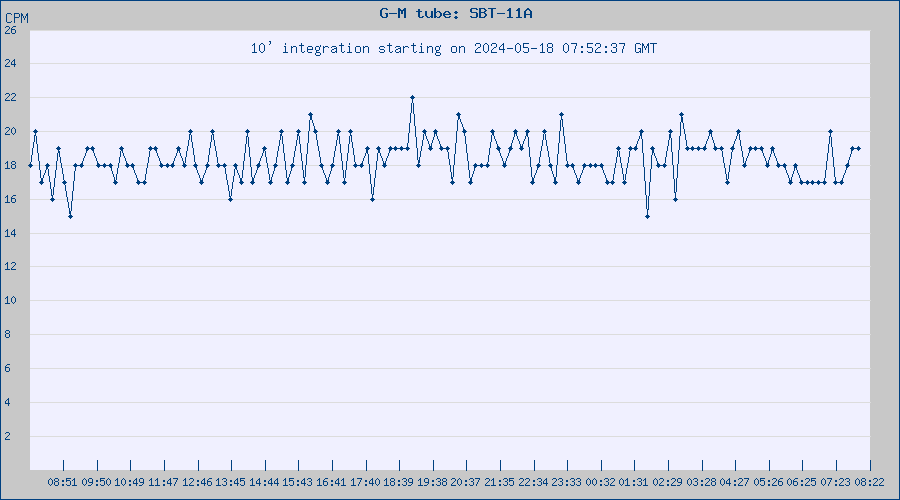
The following plot displays measurements taken during past 24 hours. They are uploaded every ten minutes to the site and a new plot is created. Data are collected as counts per minutes during ten minutes integration periods. According to the GM tube specifications (a soviet alpha tube SBT11A) the conversion factor to microsievers/hour is 318 CPM/uSv/hr. That is, an average background of 10 CPM with this tube corresponds to ~0.032 uSv/h or ~0.28 mSv/y. However, the value in uSv is referred to the calibration source, usually 137Cs, and it does not correspond to the real value that cannot be measured with a GM tube (unless there is plenty of 137Cs around...).


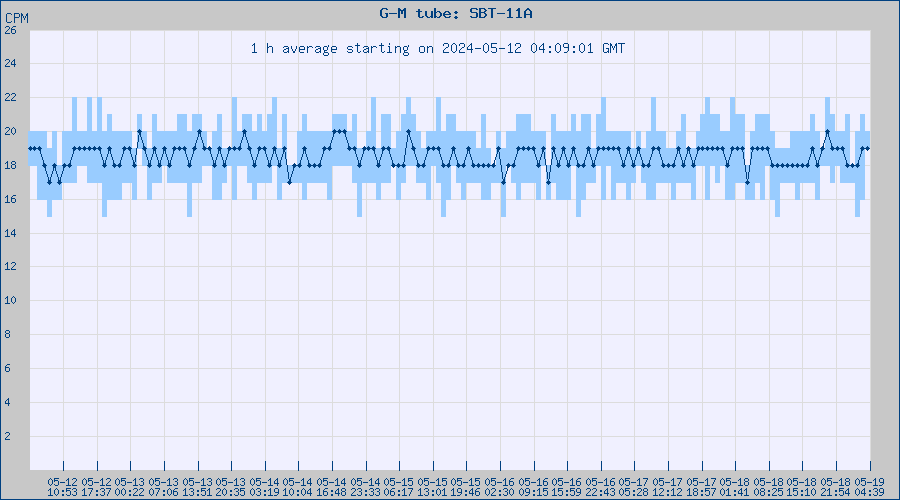
Next plot displays measurements taken during the last 7 days. On January 29, 2015, the detector has been changed. The old one had a very high, temperature dependent, dark count. On December 21, 2021, the complete system has been replaced by a new development based on a ESP8266 processor which processes the pulses and sends data directly to the database in the cloud. The G-M detector has also been replaced by another one of the same type.


